Measured
- The total weight of each pickup is measured.
- Recovery rate is the share of processed weight sent to recycling or reuse. Landfill is shown next to it.


Every ReSmart business plan comes with your own Data Dashboard. It shows what we collected, from which site, where it went and what it saved. Ready for your waste reporting, any time.
Anyone can take your waste away. We also show you what happened next.
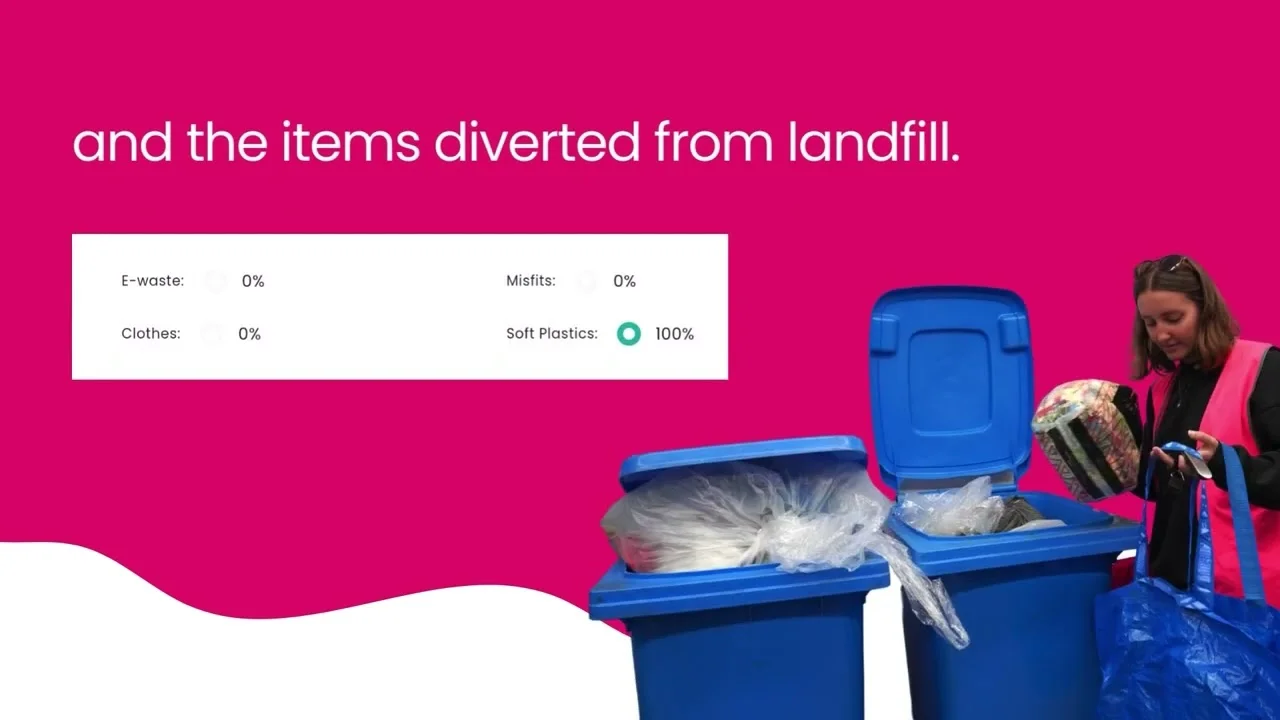
Each collection goes on the scales. The split by item type is our driver’s estimate; on some services each type is weighed separately.
Every batch is recorded to its destination: recycling, reuse or landfill. Yes, we show the landfill share too.
Filter it, export it, share it. No waiting for someone to send you a spreadsheet.

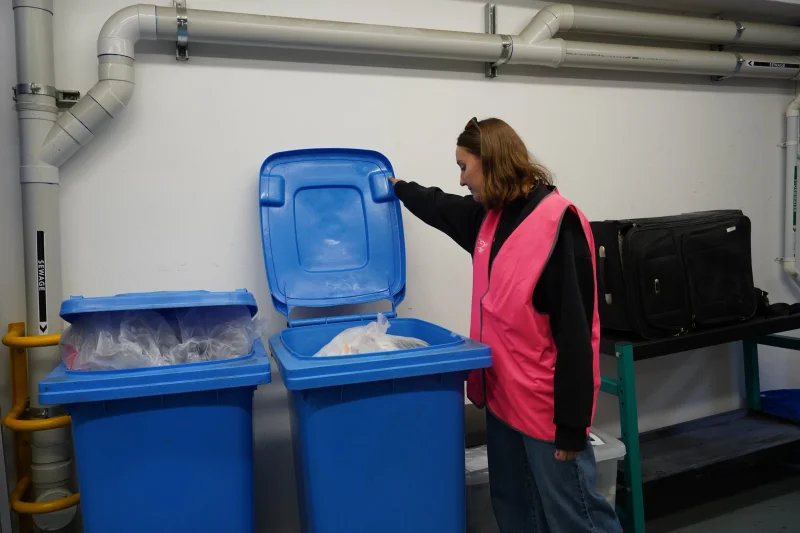
Your driver weighs the pickup, notes what is in it and takes a photo.
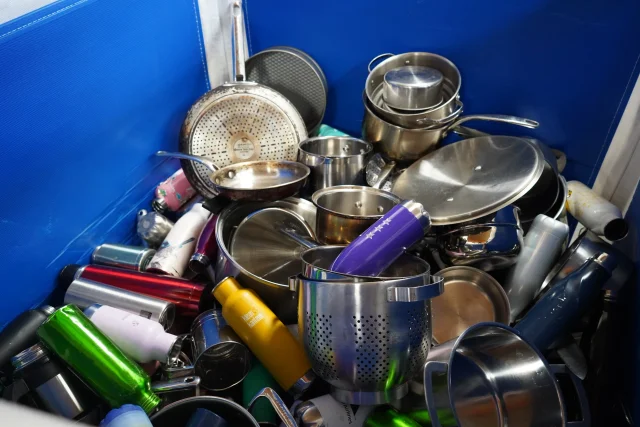
Items are checked and grouped by material.
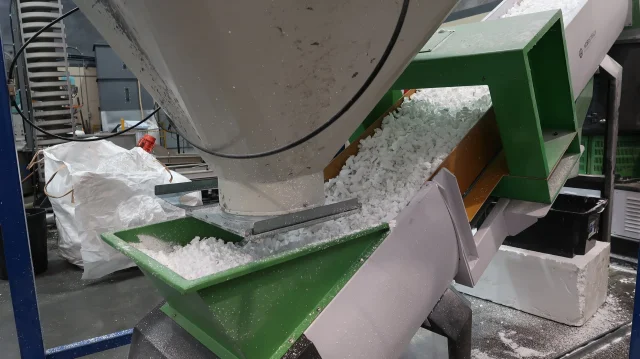
Each transfer is recorded with its destination.
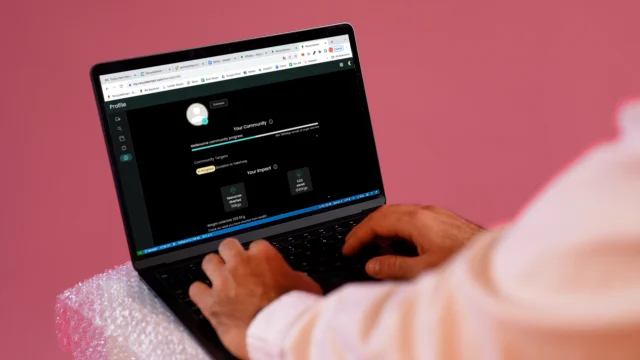
Your numbers update after every collection.
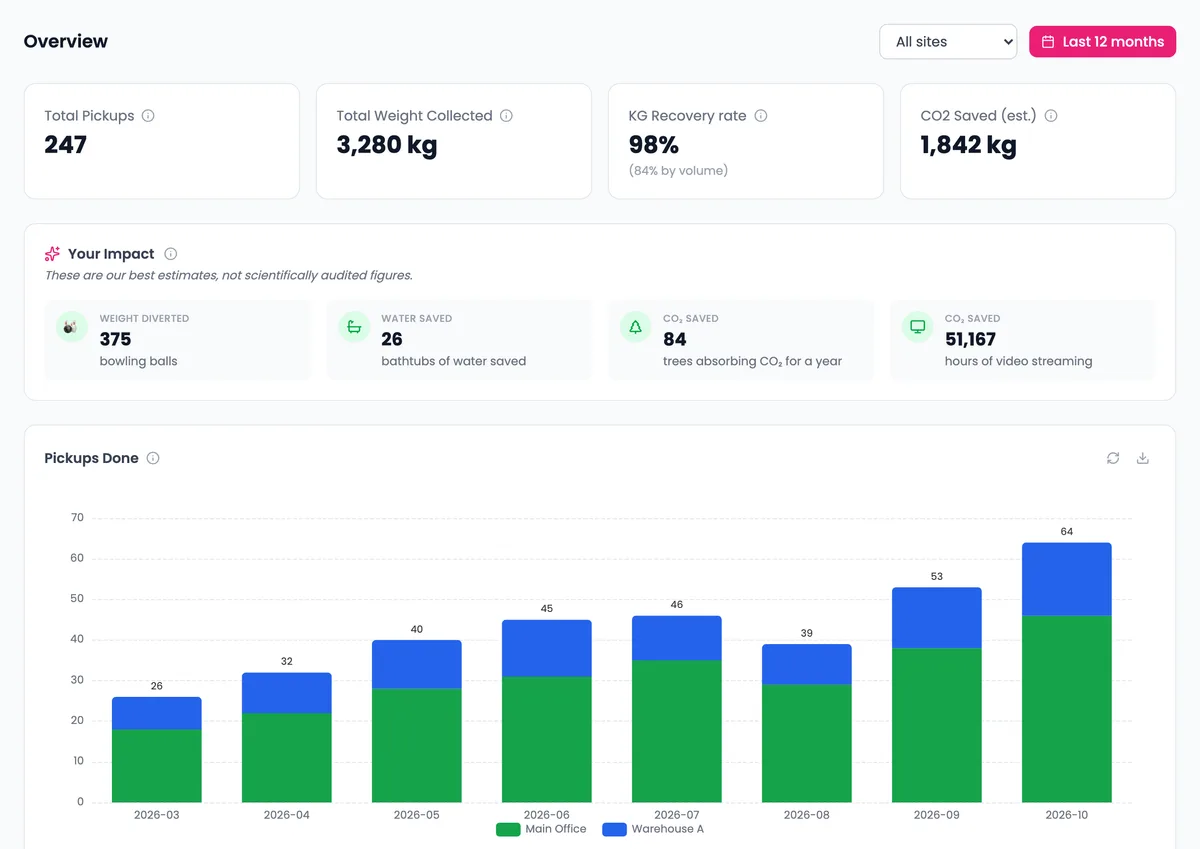
Pickups, total weight, recovery rate, CO₂ and water saved (estimates), and your upcoming pickups.
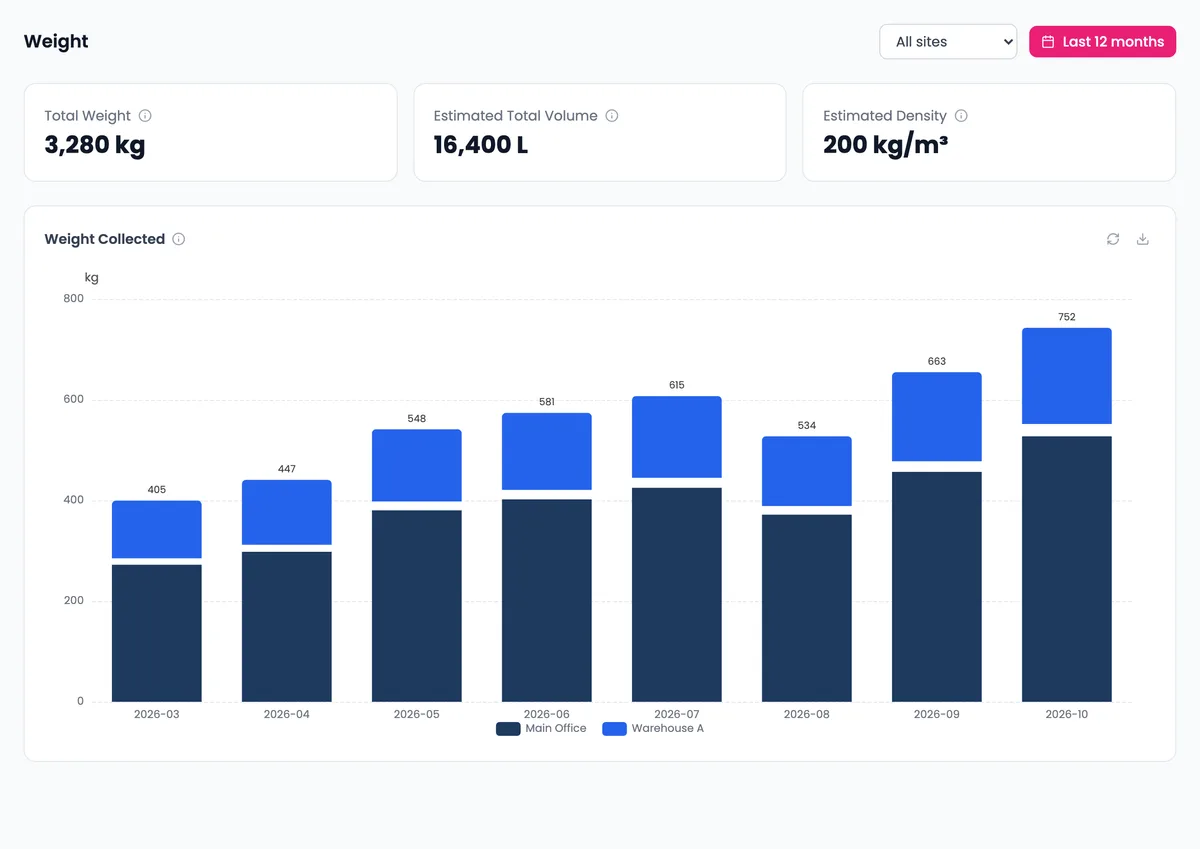
Weight and volume collected over time, by site.
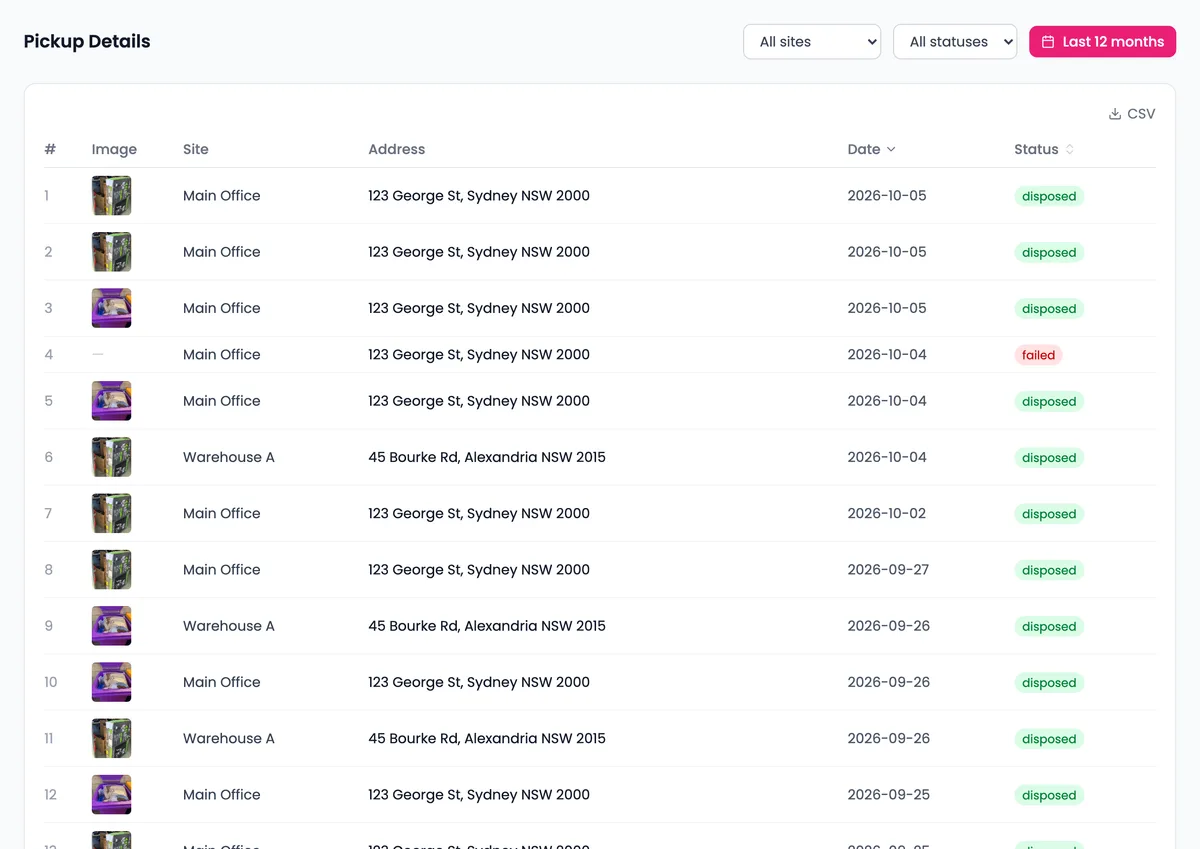
Every pickup with date, site, status and photo.
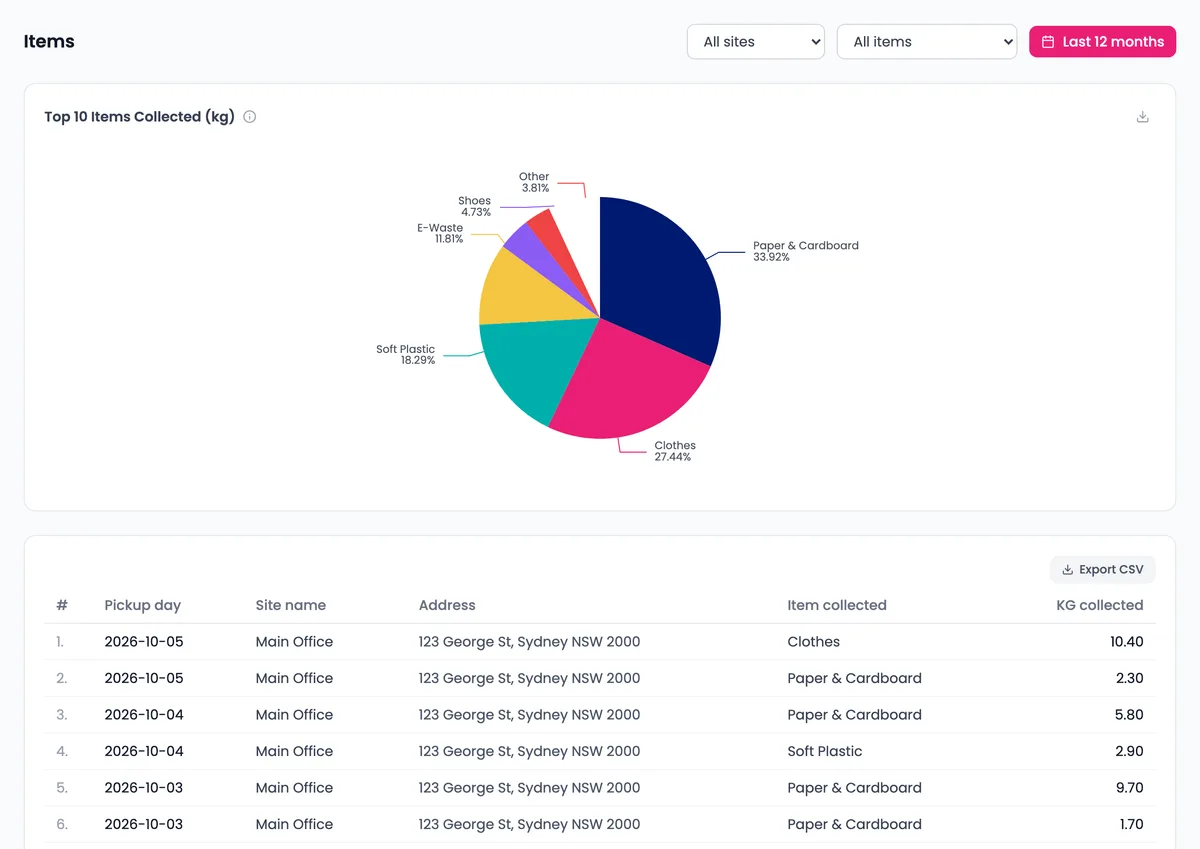
Kilograms by item type, from soft plastic to e-waste (an estimated split unless each type is weighed).
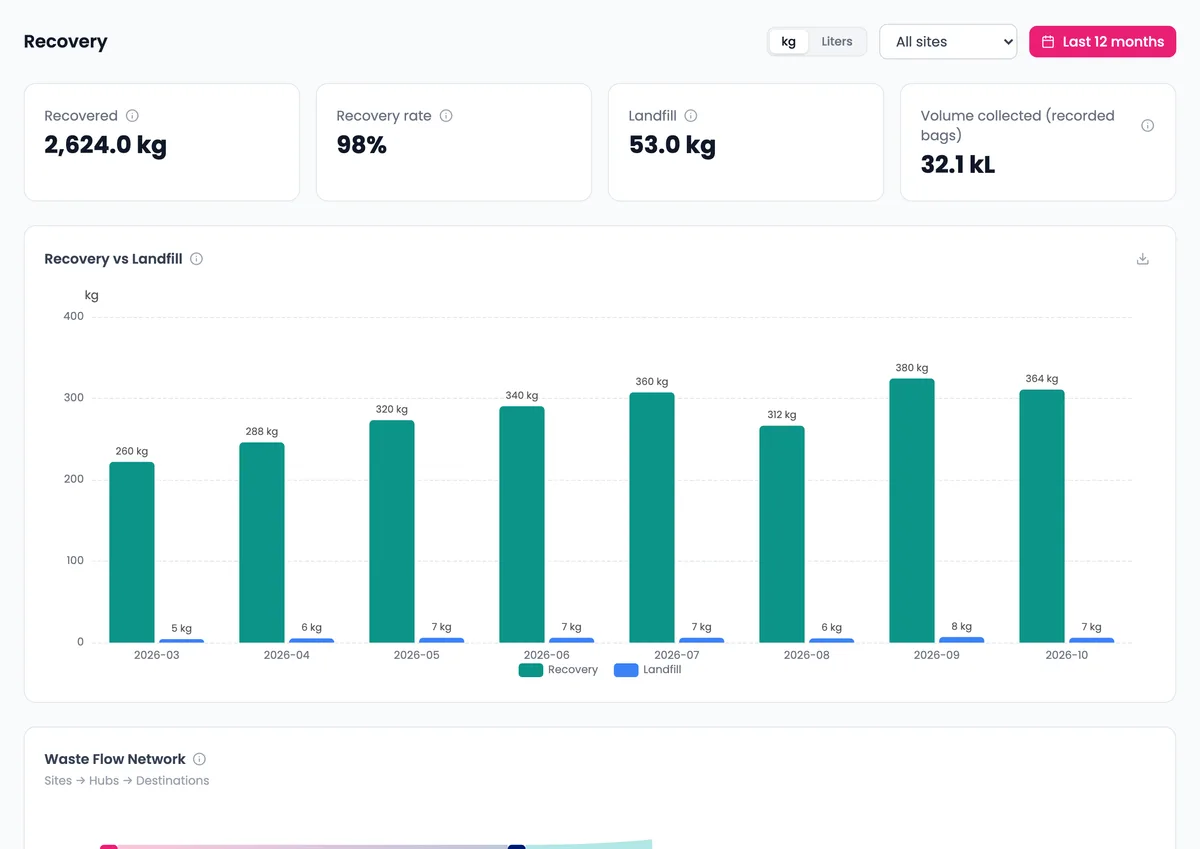
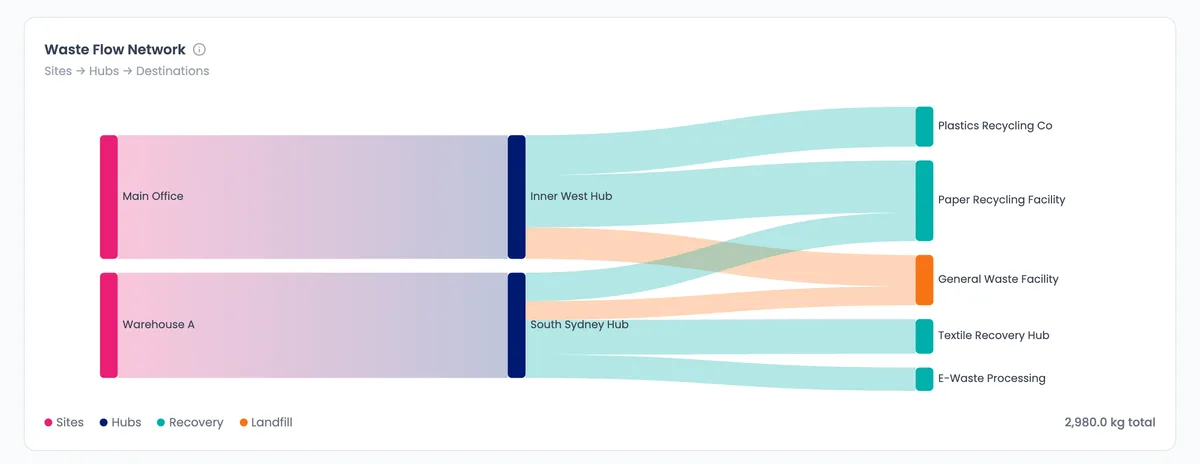
What was recovered, what went to landfill, and the route from your sites to each destination.
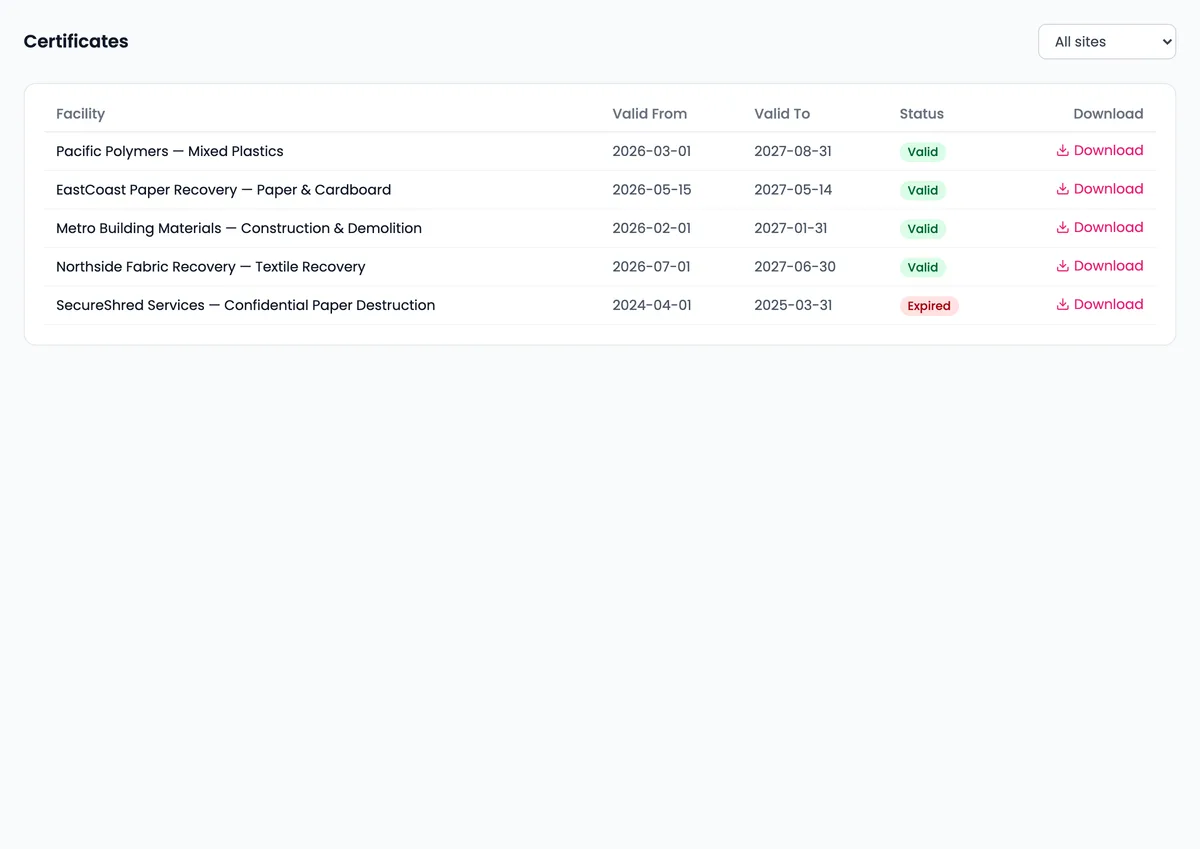
Certificates from the recycling facilities that process your items. Ask us to switch this on.
Export any date range as CSV or PDF data reports for your waste reporting.
See each location on its own or all together.
Send a link to staff, customers or your board; no login needed.
See which item types are growing and act on them.
They are our best estimates, not audited figures, and the dashboard labels them that way.
No add-on, no extra fee.
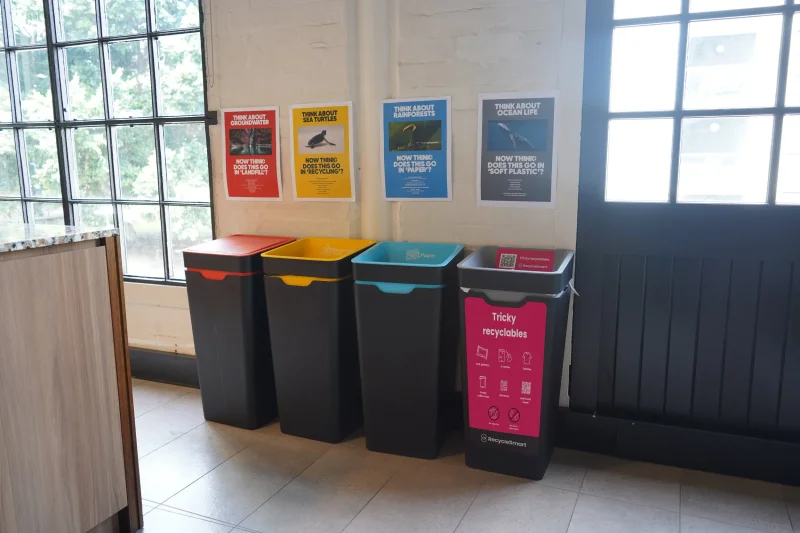

“We love our ReSmart bin in the office! It makes recycling tricky items effortless, with easy collection and hassle-free pickups. What’s even better? We can track our impact, giving insight into the difference we’re making”
Fatida - EPSON
Yes, with every Office Pack, Commercial Pack and large-scale service.
We switch it on when your plan starts and send you the link.
After every collection.
Yes, as CSV or PDF, for any date range, site or item type.
No. Each pickup’s weight is measured; the split by item type and the CO₂ and water savings are estimates.
Fill in this form or contact us directly at business@resmart.co
Prefer email? business@resmart.co